Fichier:3-Learning-curves-for-electricity-prices.png

Description
| Description |
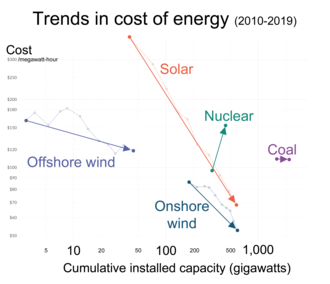
English: Do electricity prices follow learning curves?
Solar PV modules might very well follow a rapidly declining learning curve, but solar modules themselves are not what we want. We want the electricity that they produce. Does the price of solar electricity follow a learning curve? The visualization shows the relevant data. On the vertical axis you see again the LCOE price for electricity and on the horizontal axis you now find the cumulative installed capacity. As in the solar module chart, both variables are plotted on logarithmic scales so that the line on the charts represents the learning rate for these technologies. In bright orange you see the development for the price of power from solar PV over the last decade. The learning curve relationship that we saw for the price of solar modules also holds for the price of electricity. The learning rate is actually even faster: At each doubling of installed solar capacity the price of solar electricity declined by 36% – compared to 20% for solar modules. Wind power – shown in blue – also follows a learning curve. The onshore wind industry achieved a learning rate of 23%. Every doubling of capacity was associated with a price decline of almost a quarter. Offshore wind had a learning rate of 10% and is still relatively expensive – only 25% cheaper than nuclear and a bit more expensive than coal. But for two reasons experts expect the power from offshore wind to become very cheap in the coming years, larger wind turbine sizes and the fact that the consistent winds out on the sea allows higher load factors. The obvious similarity of onshore and offshore wind also means that learning effects in one industry can be transferred to the other. |
||
| Date | |||
| Source | |||
| Auteur | Our World In Data - Max Roser | ||
| Autres versions |
Français
|

|
Cette image (de type graphique) devrait être recréée dans un format vectoriel, en tant que fichier SVG. Cela offrirait plusieurs avantages : voir Commons:Media for cleanup pour plus d’informations. Si une version SVG de cette image est déjà disponible, merci de bien vouloir l’envoyer. Après cela, remplacez ce modèle par {{vector version available|nouveau nom d’image.svg}}.
|
Related file
Data for four renewable sources only, updated through 2022:
-
 2010- Decreasing renewable energy costs versus deployment.svg
(Data for four renewable sources only, updated through 2022)

.png)
_for_electricity_vs_cumulative_capacity_comparing_renewables,_coal_and_nuclear_(OWID_chart).png)
Conditions d’utilisation
- Vous êtes libre :
- de partager – de copier, distribuer et transmettre cette œuvre
- d’adapter – de modifier cette œuvre
- Sous les conditions suivantes :
- paternité – Vous devez donner les informations appropriées concernant l'auteur, fournir un lien vers la licence et indiquer si des modifications ont été faites. Vous pouvez faire cela par tout moyen raisonnable, mais en aucune façon suggérant que l’auteur vous soutient ou approuve l’utilisation que vous en faites.
Historique du fichier
Cliquer sur une date et heure pour voir le fichier tel qu'il était à ce moment-là.
| Date et heure | Vignette | Dimensions | Utilisateur | Commentaire | |
|---|---|---|---|---|---|
| actuel | 14 juin 2022 à 16:31 | | 2 879 × 2 478 (110 kio) | wikimediacommons>RCraig09 | Version 5: correcting color of "Solar" legend |
Utilisation du fichier
La page suivante utilise ce fichier :