Fichier:Associated Legendre Poly.svg

De testwiki
Aller à la navigation Aller à la recherche
Fichier d’origine (Fichier SVG, nominalement de 540 × 360 pixels, taille : 48 kio)

Ce fichier provient de Wikimedia Commons et peut être utilisé par d'autres projets. Sa description sur sa page de description est affichée ci-dessous.

Description

Description
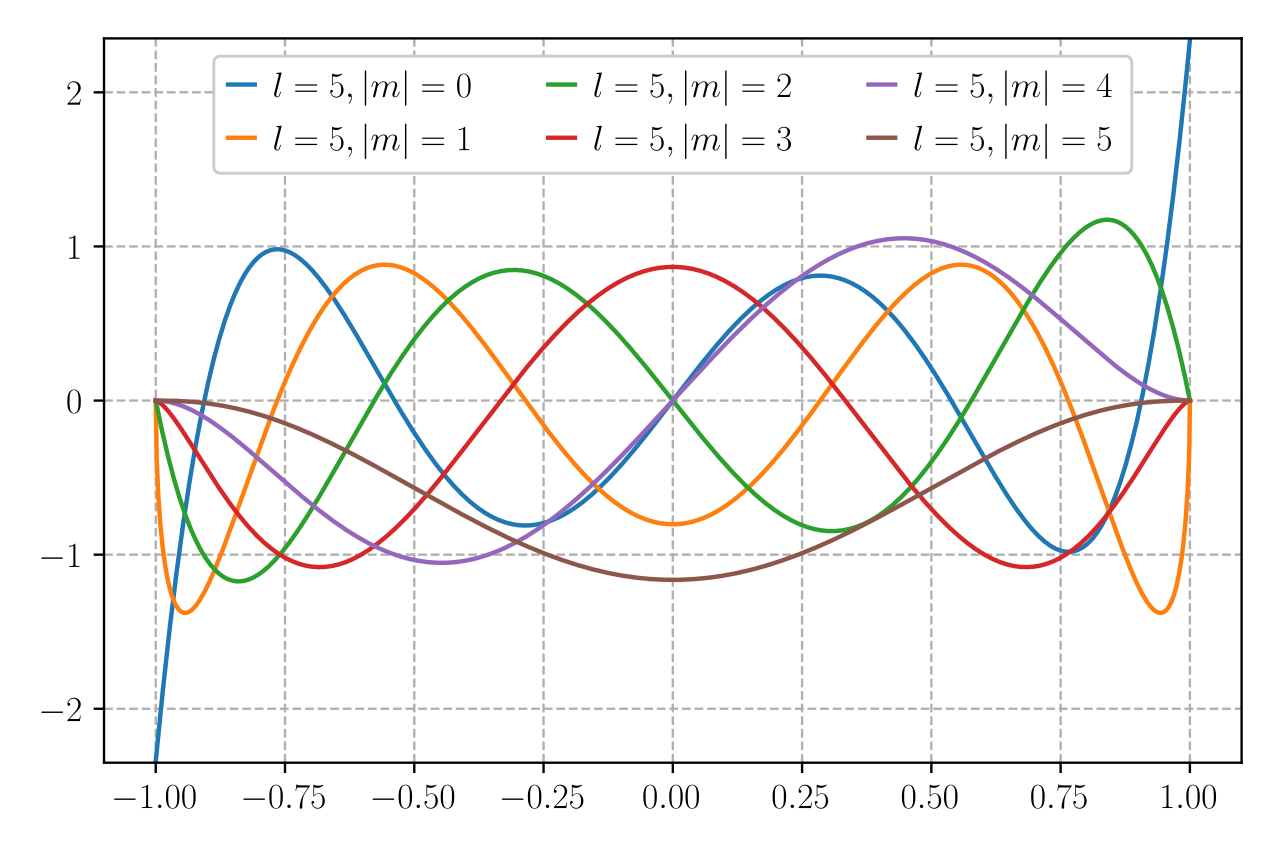
English: Curves of Associated Legendre function. The functions are normalized, i.e. what is plotted is
Date
Source Travail personnel
Auteur Krishnavedala
SVG information
InfoField
 Le code de ce fichier SVG est valide.
 Cette représentation graphique a été créée avec Matplotlib
Code source
InfoField

Python code

Source code
#include    <stdio.h>
#include    <stdlib.h>
#include    <math.h>
#include    <unistd.h>
#include    <gsl/gsl_sf_legendre.h>
#include    <plplot/plplot.h>

#ifndef PI
#define PI    3.1415926535897932384
#endif

#define		modulus(a)		(a > 0 ? a : -a)

typedef struct quant_num
{
	int l, m, n;
} quant_num;

const long unsigned int NUM_PTS = 5000;
const PLINT XMAX = 1;
const PLINT YMAX = 1;

void aLegendre(PLFLT *x, PLFLT *y, quant_num *numbers)
{
	long unsigned int i = 0;
	float step = 2.0/NUM_PTS, t = -1.0;
	
	while(t < 1.0 && i < NUM_PTS)
	{
		x[i] = (PLFLT)t;
		y[i] = (PLFLT)gsl_sf_legendre_sphPlm(numbers->l, abs(numbers->m), (const double)t);
		i++;
		t += step;
	}
}

void drawlegend(int n)
{
	PLINT 	nLegend = n+1;
	char 	*text[nLegend];
	int i;
	PLINT	opt_array[nLegend];
	PLINT	text_colors[nLegend];
	PLINT	line_colors[nLegend];
	PLINT	line_styles[nLegend];
	PLINT	line_widths[nLegend];
	PLINT 	symbol_numbers[nLegend];
	PLINT 	symbol_colors[nLegend];
	PLINT 	symbols[nLegend];
	PLFLT	symbol_scales[nLegend];
	PLINT	box_colors[nLegend] = {15};
	
	symbol_numbers[n] = n;
	symbol_colors[n] = n;
	symbols[n] 		 = '.';
	symbol_scales[n] = 1.;
	
	for(i = 0; i <= n; i++)
	{
		text[i] = malloc(15 * sizeof(char));
		if(i>0)
			sprintf(text[i], "l=5, &#124;m&#124;=%d",i);
		else
			sprintf(text[i], "l=5, m=%d",i);
		line_colors[i]	= i+1;
		line_styles[i]	= 1;
		line_widths[i]	= 1;
		text_colors[i] 	= 15;
		opt_array[i] 	= PL_LEGEND_LINE;
	}
	
	pllegend(0, 0.72, .87, .05, 15,
		nLegend, opt_array, 0.5, 0.7, 1.5, 0,
		text_colors, (const char**) text, 
		box_colors, NULL, NULL, 
		line_colors, line_styles, line_widths,
		symbol_colors, symbol_scales, symbol_numbers, symbols);
	for(i = 0; i <= n; i++)
		free(text[i]);
}

int main(void)
{
    PLFLT X[NUM_PTS], Y[NUM_PTS];
    quant_num test_num[6];
    int i;
	
    plscol0(0, 255, 255, 255);
    plinit();
    plscol0(15, 0, 0, 0);
    plcol(15);
    plenv(-XMAX,XMAX, -YMAX,YMAX, 0, 2);

    pllab("x", "P#dl#u#um#d(x)", "Associated Legendre Polynomials");
    plbox( "bcnst", 0, 0, "bcnstv", 0, 0);    plcol(1);
    for(i = 0; i <= 5; i++)
    {
		test_num[i].l = 5; 	test_num[i].m = i; 	test_num[i].n = 1; 
		orbital(X, Y, &test_num[i]); plcol(i+1);
		plline(NUM_PTS, X, Y);
    }

    drawlegend(test_num[0].l);
    
    plend();

    return 0;
}

Data

Source code
import matplotlib.pyplot as plt
from scipy.special import lpmv
import numpy as np
plt.rc('svg', fonttype='none')
plt.rc('text', usetex=1)

dt = 1e-3
l = 5
x = np.arange(-1, 1, dt)
y = []
for m in range(l+1):
    y.append(lpmv(m, l, x))
    
fig, ax = plt.subplots(1,1, figsize=(10,6))
for m in range(l+1):
    ax.plot(x, y[m] / np.linalg.norm(y[m]), label=r'$l=%d, &#124;m&#124;=%d$' % (l, m))
ax.grid(True)
ax.legend()
ax.minorticks_on()
ax.set_xlim([-1,1])
ax.set_xlabel(r'$x$')
ax.set_ylabel(r'$P_l^m(x)$')
fig.savefig('legendre.svg', bbox_inches='tight')

Conditions d’utilisation

Moi, en tant que détenteur des droits d’auteur sur cette œuvre, je la publie sous les licences suivantes :
w:fr:Creative Commons
paternité partage à l’identique
Ce fichier est disponible selon les termes de la licence Creative Commons Attribution – Partage dans les Mêmes Conditions 3.0 Non Transposé.
Vous êtes libre :
  • de partager – de copier, distribuer et transmettre cette œuvre
  • d’adapter – de modifier cette œuvre
Sous les conditions suivantes :
  • paternité – Vous devez donner les informations appropriées concernant l'auteur, fournir un lien vers la licence et indiquer si des modifications ont été faites. Vous pouvez faire cela par tout moyen raisonnable, mais en aucune façon suggérant que l’auteur vous soutient ou approuve l’utilisation que vous en faites.
  • partage à l’identique – Si vous modifiez, transformez ou vous basez sur cet élément, vous devez distribuer votre contribution sous une license identique ou compatible à celle de l’original.
GNU head Vous avez la permission de copier, distribuer et modifier ce document selon les termes de la GNU Free Documentation License version 1.2 ou toute version ultérieure publiée par la Free Software Foundation, sans sections inaltérables, sans texte de première page de couverture et sans texte de dernière page de couverture. Un exemplaire de la licence est inclus dans la section intitulée GNU Free Documentation License.
Vous pouvez choisir l’une de ces licences.

Légendes

Ajoutez en une ligne la description de ce que représente ce fichier

Éléments décrits dans ce fichier

dépeint

image/svg+xml

16ecdc42e0ba939e12c1f09283ede01be5608034

49 502 octet

360 pixel

540 pixel

Historique du fichier

Cliquer sur une date et heure pour voir le fichier tel qu'il était à ce moment-là.

Date et heureVignetteDimensionsUtilisateurCommentaire
actuel3 décembre 2020 à 21:38Vignette pour la version du 3 décembre 2020 à 21:38540 × 360 (48 kio)wikimediacommons>AkanoToEAdjusted normalization, legend formatting, and text formatting

La page suivante utilise ce fichier :