Fichier:Europe geos5 2019178.png
Description
| Description |
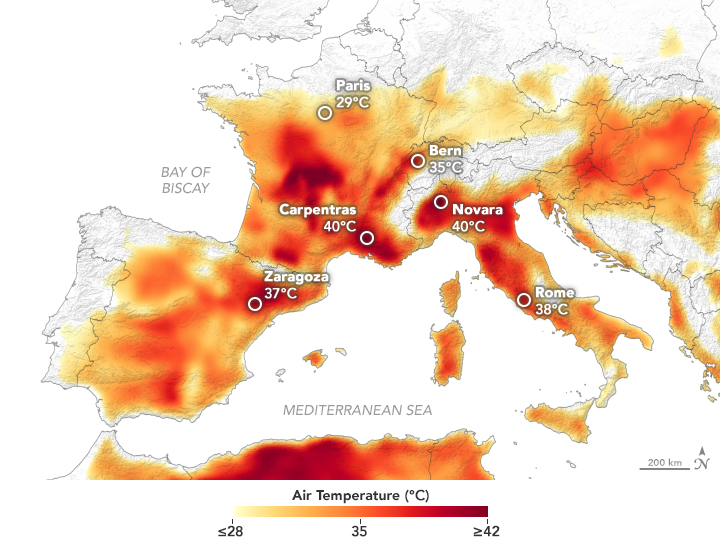
English: It’s early summer and Europe is already feeling the heat. Many parts of the continent saw the hottest temperatures so far for 2019, with some cities recording their hottest day on record.
The heatwave is apparent on this map, which shows temperatures across Europe on June 27, 2019. The map was derived from the Goddard Earth Observing System (GEOS) model, and represents air temperatures at 2 meters (about 6.5 feet) above the ground. The darkest red areas are where the model shows temperatures surpassing 40°C (100°F). The GEOS model, like all weather and climate models, uses mathematical equations that represent physical processes (like precipitation and cloud processes) to calculate what the atmosphere will do. Actual measurements of physical properties, like temperature, moisture, and winds, are routinely folded into the model to keep the simulation as close to observed reality as possible. On June 27, an awareness report from the Network of European Meteorological Services specified “very dangerous” temperatures—the highest alert level—in parts of Spain, France, Switzerland, and Croatia. The meteorological department in France listed numerous cities where records for the hottest June day were broken, many of which were set during the deadly heatwave in 2003. France’s national record for the hottest temperature (of any time of the year), set in 2003, was broken in the town of Carpentras, which hit 45.9°C (114.6°F) on June 28 at 4:20 p.m. local time. The 2019 heatwave got its start in late June, when warm air masses from the Sahara first hit Spain and then spread to Central Europe. News reports also cite a pair of high-pressure systems responsible for drawing in the warm air and suppressing cloud cover.
Deutsch: Es ist Frühsommer und Europe leidet bereits unter der Hite. Große Teile des Kontinents erlebten die bsher heißesten Temperaturen des Jahres 2019, und einige Städte verzeichneten ihren wärmsten Tag seit Beginn der Aufzeichnungen.
Die Hitzewelle ist auf der Karte sichtbar; sie zeigt die Temperaturen quer durch Europa am 27. Juni 2019. Die Karte wurde erstellt anhand von Daten aus dem Goddard-Earth-Observing-System-Modell (GEOS) und zeigt die Lufttemperaturen in zwei Metern Höhe über dem Boden. Die dunkelsten rot eingezeichneten Gebiete sind solche, in denen das Modell Temperaturen von über 40 °C ermittelt hat. Das GEOS-Modell verwendet, wie alle Wetter- und Klimamodelle, mathematische Gleichungen, die die physikalischen Prozesse wie Niederschlag und Wolkenbildung abbilden, um zu berechnen, was die Atmosphäre tun wird. Aktuelle Messungen von physikalischen Daten wie Temperatur, Luftfeuchtigkeit und Wind weren ständig in das Modell übernommen, um die Simulation so nahe an die beobachtete Realität anzupassen wie es möglich ist. Am 27. Juni warnte Meteoalarm vor “sehr gefährlich” hohen Temperaturen — der höchsten Alarmstufe — in Teilen von Spanien, Frankreich, der Schweiz und Kroatien. Der französische Wetterdienst Météo-France listete zahlreiche Städte, in denen die Rekorde für den wärmsten Junitag gebrochen wurden, viele der bisherigen Werte stammten aus der tödlichen Hitzewelle von 2003. Frankreichs nationaler Alzeitwetterrekord stammte aus dem Jahr 2003 und wurde am 28. Juni um 16:20 MESZ in Carpentras gebrochen, wo 45,9 °C erreicht wurden. Die Hitzewelle von 2019 begann Ende Juni, als warme Luftmassen aus der Sahara zuerst nach Spanien und dann nach Mitteleuropa gelangten. Nachrichtenmeldungen deuten an, dass ein Paar von Hochdruckgebieten dafür verantwortlich ist, warme Luft nach Europa zu schaufeln und die Wolkenbildung zu unterdrücken.
|
| Date | |
| Source | https://earthobservatory.nasa.gov/images/145249/heatwave-scorches-europe |
| Auteur | NASA Earth Observatory image by Joshua Stevens, using GEOS-5 data from the Global Modeling and Assimilation Office at NASA GSFC. Story by Kathryn Hansen. |
| Autres versions |
 hi res, unlabeled |
References & Resources
- Mashable (2019, June 27) Record-breaking heat wave cooks Europe. Accessed June 28, 2019.
- Meteoalarm (2019, June 27) Weather warnings: Europe. Accessed June 28, 2019.
- Météo France (2019, June 28) Record absolu de chaleur battu : 45,9°C dans le Gard, du jamais vu en France. Accessed June 28, 2019.
- The Washington Post (2019, June 28) Capital Weather Gang: Europe heat wave: France records all-time highest temperature of 115 degrees. Accessed June 28, 2019.
- World Meteorological Organization (2019, June 28) Europe sees first heatwave of the year. copie d'archive sur Wayback Machine Accessed June 28, 2019.
Conditions d’utilisation
| Ce fichier provient de la NASA. Sauf exception, les documents créés par la NASA ne sont pas soumis à copyright. Pour plus d'informations, voir la politique de copyright de la NASA. | ||
 |
Attention :
|
Historique du fichier
Cliquer sur une date et heure pour voir le fichier tel qu'il était à ce moment-là.
| Date et heure | Vignette | Dimensions | Utilisateur | Commentaire | |
|---|---|---|---|---|---|
| actuel | 29 juin 2019 à 14:32 | | 720 × 545 (367 kio) | wikimediacommons>Matthiasb | {{Information |description ={{en|1=It’s early summer and Europe is already feeling the heat. Many parts of the continent saw the hottest temperatures so far for 2019, with some cities recording their hottest day on record. The heatwave is apparent on this map, which shows temperatures across Europe on June 27, 2019. The map was derived from the [https://earthobservatory.nasa.gov/images/44246/geos-5-a-high-resolution-global-atmospheric-model Goddard Earth Observing System] (GEOS) model, and... |
Utilisation du fichier
La page suivante utilise ce fichier :