Fichier:Interpolation example spline.svg
Aller à la navigation
Aller à la recherche

Taille de cet aperçu PNG pour ce fichier SVG : 600 × 480 pixels. Autres résolutions : 300 × 240 pixels | 960 × 768 pixels | 1 280 × 1 024 pixels | 2 560 × 2 048 pixels.
Fichier d’origine (Fichier SVG, nominalement de 600 × 480 pixels, taille : 13 kio)
Description
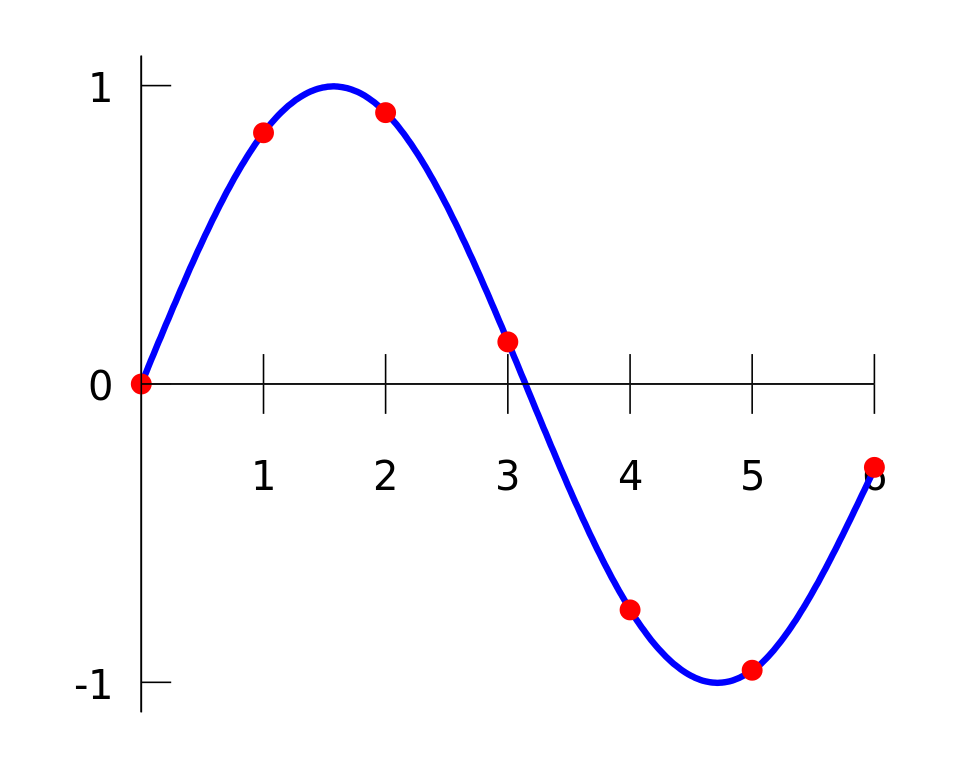
| Description | IIllustration of spline interpolation of a data set. The same data set is used for other interpolation algorithms in the Interpolation. |
| Date | |
| Source | self-made in Gnuplot |
| Auteur | Berland |
Based on png-version by User:Jitse Niesen (with gnuplot source code), and on svg-version by User:Cronholm144.
Gnuplot source code
set terminal svg fname "Vera" fsize 25
set output "Interpolation_example_spline.svg"
set key off
set xzeroaxis
set xtics axis 1,1
set ytics nomirror 1
set samples 300
set border 2
f(x) = (x >= 0 && x < 1) ? -0.1522*x**3 + 0.9937*x : \
       (x >= 1 && x < 2) ? -0.01258*x**3 - 0.4189*x**2 + 1.4126*x - 0.1396 : \
       (x >= 2 && x < 3) ? 0.1403*x**3 - 1.3359*x**2 + 3.2467*x - 1.3623 : \
       (x >= 3 && x < 4) ? 0.1579*x**3 - 1.4945*x**2 + 3.7225*x - 1.8381 : \
       (x >= 4 && x < 5) ? 0.05375*x**3 -0.2450*x**2 - 1.2756*x + 4.8259 : \
                           -0.1871*x**3 + 3.3673*x**2 - 19.3370*x + 34.9282
set yrange [-1.1:1.1]
plot f(x) with lines linetype 3 linewidth 4, \
     "-" with points linetype 1 pointtype 7 pointsize 0.7,\
	 0 with lines linetype -1 linewidth 1
0 0
1 0.8415
2 0.9093
3 0.1411
4 -0.7568
5 -0.9589
6 -0.2794
e
Please use at least version 4.2 of Gnuplot for smooth lines in SVG.
Conditions d’utilisation
| Cette œuvre a été placée dans le domaine public par son auteur, Berland. Ceci s’applique dans le monde entier. Dans certains pays, ceci peut ne pas être possible ; dans ce cas : Berland accorde à toute personne le droit d’utiliser cette œuvre dans n’importe quel but, sans aucune condition, sauf celles requises par la loi. |
Historique du fichier
Cliquer sur une date et heure pour voir le fichier tel qu'il était à ce moment-là.
| Date et heure | Vignette | Dimensions | Utilisateur | Commentaire | |
|---|---|---|---|---|---|
| actuel | 25 juin 2007 à 22:02 | | 600 × 480 (13 kio) | wikimediacommons>Berland | {{Information |Description=Illustration of spline interpolation on a data set, compared with other interpolation methods in the article Interpolation. Based on png-version by User:Jitse Niesen and svg |
Utilisation du fichier
La page suivante utilise ce fichier :