Fichier:Nonquasiconvex function.png
Aller à la navigation
Aller à la recherche
Pas de plus haute résolution disponible.
Nonquasiconvex_function.png (472 × 396 pixels, taille du fichier : 14 kio, type MIME : image/png)
Description
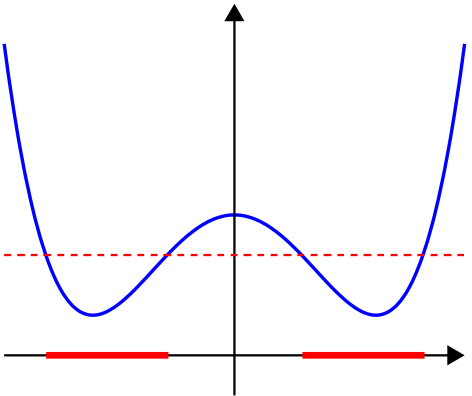
Made by myself with MATLAB

|
Cette image (de type graphique) devrait être recréée dans un format vectoriel, en tant que fichier SVG. Cela offrirait plusieurs avantages : voir Commons:Media for cleanup pour plus d’informations. Si une version SVG de cette image est déjà disponible, merci de bien vouloir l’envoyer. Après cela, remplacez ce modèle par {{vector version available|nouveau nom d’image.svg}}.
|
Conditions d’utilisation
| Moi, propriétaire des droits d’auteur sur cette œuvre, la place dans le domaine public. Ceci s'applique dans le monde entier. Dans certains pays, ceci peut ne pas être possible ; dans ce cas : J’accorde à toute personne le droit d’utiliser cette œuvre dans n’importe quel but, sans aucune condition, sauf celles requises par la loi. |
Source code
function main()

% prepare the scrreen and define some parameters
clf; hold on; axis equal; axis off;
fontsize=25; thick_line=3; thin_line=2; black=[0, 0, 0]; red=[1, 0, 0];
arrowsize=0.1; arrow_type=1; arrow_angle=30; % (angle in degrees)

L=1.15;

X=(-L):0.01:(L);
f=inline('2*(X.^4-X.^2+1)-1.3');
Y=f(X);
plot(X, Y, 'linewidth', thick_line)

arrow([X(1) 0], [X(length(X)), 0],          thin_line, arrowsize, arrow_angle, arrow_type, black)
arrow([0 min(Y)-0.4], [0 max(Y)+0.2], thin_line, arrowsize, arrow_angle, arrow_type, black)


a=0.5; Z=X*0+a;
plot(X, Z, 'linewidth', thin_line, 'linestyle', '--', 'color', 'r');

x0=-10;

for i=2:(length(X)-1)
   x=X(i); xp=X(i-1);

   if x < 0 & f(x) < a & f(xp) >= a
      x0=x;
   elseif x < 0 & f(x) >= a & f(xp) < a
      x1=x;
   elseif x > 0 & f(x) <= a & f(xp) > a
      x2=x;
   elseif x > 0 & f(x) >= a & f(xp) < a
      x3=x;
   end
end

plot([x0, x1],  [0, 0], 'linewidth', 2*thick_line, 'color', 'r');
plot([x2, x3],  [0, 0], 'linewidth', 2*thick_line, 'color', 'r');

saveas(gcf, 'Nonquasiconvex_function.eps', 'psc2') % export to eps


function arrow(start, stop, thickness, arrow_size, sharpness, arrow_type, color)

% Function arguments:
% start, stop:  start and end coordinates of arrow, vectors of size 2
% thickness:    thickness of arrow stick
% arrow_size:   the size of the two sides of the angle in this picture ->
% sharpness:    angle between the arrow stick and arrow side, in degrees
% arrow_type:   1 for filled arrow, otherwise the arrow will be just two segments
% color:        arrow color, a vector of length three with values in [0, 1]

% convert to complex numbers
   i=sqrt(-1);
   start=start(1)+i*start(2); stop=stop(1)+i*stop(2);
   rotate_angle=exp(i*pi*sharpness/180);

% points making up the arrow tip (besides the "stop" point)
   point1 = stop - (arrow_size*rotate_angle)*(stop-start)/abs(stop-start);
   point2 = stop - (arrow_size/rotate_angle)*(stop-start)/abs(stop-start);

   if arrow_type==1 % filled arrow

      % plot the stick, but not till the end, looks bad
      t=0.5*arrow_size*cos(pi*sharpness/180)/abs(stop-start); stop1=t*start+(1-t)*stop;
      plot(real([start, stop1]), imag([start, stop1]), 'LineWidth', thickness, 'Color', color);

      % fill the arrow
      H=fill(real([stop, point1, point2]), imag([stop, point1, point2]), color);
      set(H, 'EdgeColor', 'none')

   else % two-segment arrow
      plot(real([start, stop]), imag([start, stop]),   'LineWidth', thickness, 'Color', color);
      plot(real([stop, point1]), imag([stop, point1]), 'LineWidth', thickness, 'Color', color);
      plot(real([stop, point2]), imag([stop, point2]), 'LineWidth', thickness, 'Color', color);
   end
|
|
Cette image (de type mathématique) devrait être recréée dans un format vectoriel, en tant que fichier SVG. Cela offrirait plusieurs avantages : voir Commons:Media for cleanup pour plus d’informations. Si une version SVG de cette image est déjà disponible, merci de bien vouloir l’envoyer. Après cela, remplacez ce modèle par {{vector version available|nouveau nom d’image.svg}}.
|
Historique du fichier
Cliquer sur une date et heure pour voir le fichier tel qu'il était à ce moment-là.
| Date et heure | Vignette | Dimensions | Utilisateur | Commentaire | |
|---|---|---|---|---|---|
| actuel | 27 janvier 2007 à 21:26 | | 472 × 396 (14 kio) | wikimediacommons>Oleg Alexandrov | Made by myself with MATLAB |
Utilisation du fichier
La page suivante utilise ce fichier :