Fichier:Archimedean spiral polar.svg
Aller à la navigation
Aller à la recherche

Taille de cet aperçu PNG pour ce fichier SVG : 591 × 600 pixels. Autres résolutions : 236 × 240 pixels | 473 × 480 pixels | 757 × 768 pixels | 1 009 × 1 024 pixels | 2 018 × 2 048 pixels | 609 × 618 pixels.
Fichier d’origine (Fichier SVG, nominalement de 609 × 618 pixels, taille : 91 kio)
Description
| Description |
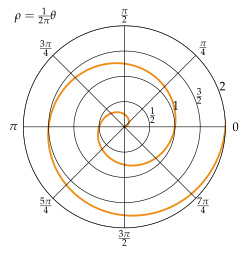
Français : Spirale d'Archimède représentée sur un graphe polaire English: Archimedean spiral represented on a polar graph |
| Date | |
| Source | Travail personnel |
| Auteur | Guillaume Jacquenot |
Source code (Python)
# -*- coding: utf-8 -*-
#
# Script to plot an Archimedean spiral
#
# http://en.wikipedia.org/wiki/Archimedean_spiral
#
# The Archimedean spiral (also known as the arithmetic spiral
# or spiral of Archimedes) is a spiral named after the 3rd
# century BC Greek mathematician Archimedes. It is the locus
# of points corresponding to the locations over time of a
# point moving away from a fixed point with a constant speed
# along a line which rotates with constant angular velocity.
#
# Text under the
# Creative Commons Attribution-ShareAlike License
# **************************************************************
#
#
# Guillaume Jacquenot
# 2013/03/17

import numpy as np
from fractions import Fraction
import matplotlib
from matplotlib.pyplot import figure, show, rc, grid

def updateThetaAxis(ax):
    thetaFractions = [Fraction.from_float(item/np.pi) for item in ax.get_xticks()]
    labels=[]
    for f in thetaFractions:
        if f.numerator==0:
            labels.append('0')
        elif f.numerator==f.denominator:
            labels.append('\\pi')
        elif f.numerator==1:
            labels.append('\\frac{{\\pi }}{'+str(f.denominator)+'}')
        else:
            labels.append('\\frac{{'+str(f.numerator)+'\\pi }}{'+str(f.denominator)+'}')
    labels = ['$\\Large'+l+'$' for l in labels]
    ax.set_xticklabels(labels,fontsize=20)

def updateRAxis(ax):
    thetaFractions = [Fraction.from_float(item) for item in ax.get_yticks()]
    labels=[]
    for f in thetaFractions:
        if f.numerator==0:
            labels.append('0')
        elif f.numerator==f.denominator:
            labels.append('1')
        elif f.denominator==1:
            labels.append(str(f.numerator))
        else:
            labels.append('\\frac{{'+str(f.numerator)+'}}{'+str(f.denominator)+'}')
    labels = ['$'+l+'$' for l in labels]
    ax.set_yticklabels(labels,fontsize=20)

def makePlot(outputFilename = r'Archimedean_spiral_polar.svg'):
    rc('grid', linewidth=1, linestyle='-') # color='#316931'
    rc('xtick', labelsize=15)
    rc('ytick', labelsize=15)
    rc('font',**{'family':'serif','serif':['Palatino'],'size':14})
    rc('text', usetex=True)

    width, height = matplotlib.rcParams['figure.figsize']
    size = min(width, height)
    fig = figure(figsize=(size, size))
    ax = fig.add_axes([0.12, 0.12, 0.76, 0.76], polar=True, )#axisbg='#d5de9c'

    r = np.arange(0, 3.0, 0.01)
    theta = 2*np.pi*r
    ax.plot(theta, r, color='#ee8d18', lw=3)
    ax.set_rmax(2.0)
    updateThetaAxis(ax)
    updateRAxis(ax)
    grid(True)
    ax.set_title('$\\rho=\\frac{1}{2\\pi}\\theta$',fontsize=20)
    fig.savefig(outputFilename)
    fig.show()

makePlot()
Conditions d’utilisation
Moi, en tant que détenteur des droits d’auteur sur cette œuvre, je la publie sous la licence suivante :
Ce fichier est disponible selon les termes de la licence Creative Commons Attribution – Partage dans les Mêmes Conditions 3.0 Non Transposé.
- Vous êtes libre :
- de partager – de copier, distribuer et transmettre cette œuvre
- d’adapter – de modifier cette œuvre
- Sous les conditions suivantes :
- paternité – Vous devez donner les informations appropriées concernant l'auteur, fournir un lien vers la licence et indiquer si des modifications ont été faites. Vous pouvez faire cela par tout moyen raisonnable, mais en aucune façon suggérant que l’auteur vous soutient ou approuve l’utilisation que vous en faites.
- partage à l’identique – Si vous modifiez, transformez ou vous basez sur cet élément, vous devez distribuer votre contribution sous une license identique ou compatible à celle de l’original.
Historique du fichier
Cliquer sur une date et heure pour voir le fichier tel qu'il était à ce moment-là.
| Date et heure | Vignette | Dimensions | Utilisateur | Commentaire | |
|---|---|---|---|---|---|
| actuel | 18 mars 2013 à 19:17 | | 609 × 618 (91 kio) | wikimediacommons>AnonMoos | move formula to side, adjust margins |
Utilisation du fichier
La page suivante utilise ce fichier :